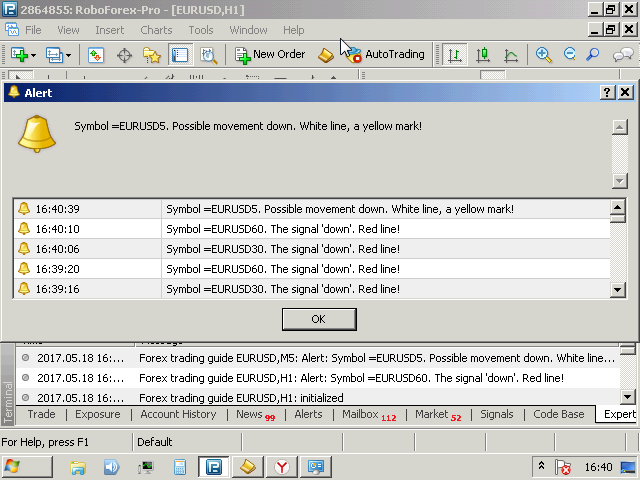
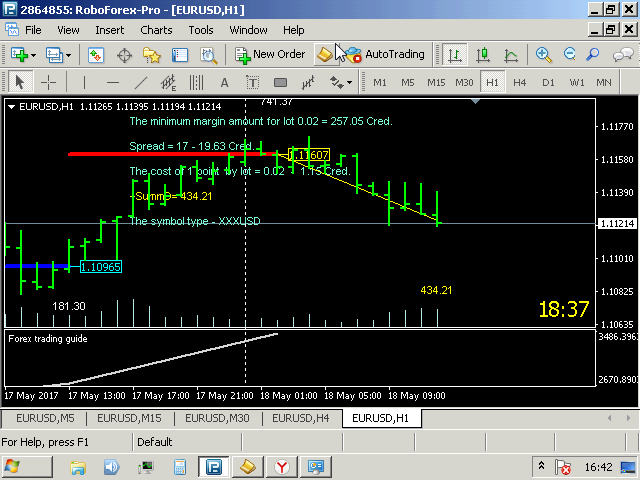
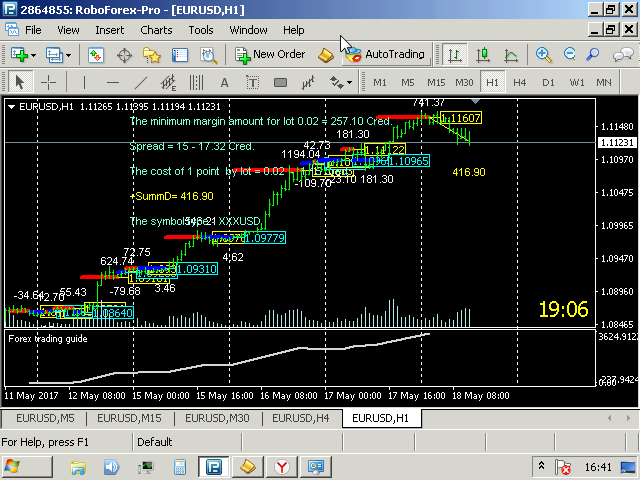
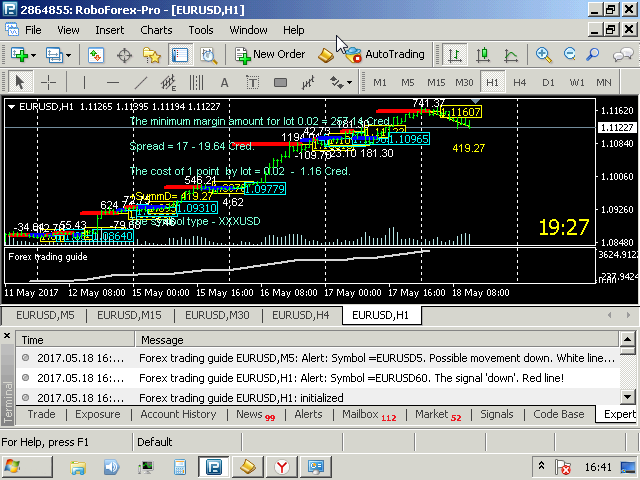
The Forex Trading Guide indicator works based on the standard RSI indicator with an adjustable period. Crossing the internal level calculated mathematically, the indicator gives a signal for opening a trade in a certain direction, showing it on the price chart with the corresponding line (blue - deal up, red - deal down) and the price label of the corresponding color . In other words, if the previous directive was to deal down (the line and the price label in red), then the next directive will be to reverse the deal, deal up (the line and the price label in blue). Appearance of a deal directive is preceded by the appearance of a white line with the price label, colored accordingly. That is, the appearance of a white price label indicates that the intersection of the signal levels has taken place in the indicator;s calculations, and it is necessary to reverse the deal.
The indicator is drawn from the leftmost visible bar to the bar with index 0, i.e. current . The very first leftmost bar (if it is visible on the chart) will be the starting bar for the indicator calculations.
The indicator provides the ability to link the current or manually specified spread, selected lot, selected exchange rate of the national currency to the deposit currency, as well as the multiplier (equal to 100, in case a cent account is used) and price levels assigned by the indicator in order to plot the profitability curve, which shows the estimated accuracy . The profitability curve is designed to simplify the selection of an instrument and its spread for the deposit. The indicator reports the required account margin and the value of one point in the national currency for the selected lot size. It also shows the costs for the current or manually specified spread. The type of the instrument, the direct, indirect quotes and cross rates are reported.
The strategy profitability curve (estimated accuracy) is based on the calculated amount of points between the signal lines with consideration of the spread for the specified lot. The equivalents in the recalculated national currency according to the data entered in the input parameters are indicated above and below the signal lines.
Indicator Parameters
- OnOffLines - enable/disable drawing the lines (enabled).
- RSI - period of the RSI indicator (13).
- Lot - lot size selected for calculations (0.02).
- Exch - exchange rate of a unit of national currency per unit of deposit currency (Russia - 57 rubles for $1).
- Cent - adjustment coefficient (100 for a cent account, otherwise 1).
- AlertOnOff - enable/disable alerts about the indicator signals.
- MailOnOff - if alerts are enabled, sends a message to email.
- OnOffMSpread - enable/disable setting the spread manually for the weekend (false).
- MSpread - spread.
- font_size - text font size (10);
- font_name - font name ("Arial");
- LineUPColor - color of the Up signal lines (clrBlue);
- LineDOWNColor - color of the Down signal lines (clrRed);
- MarkUPColor - color of the "Up" price labels (clrCyan);
- MarkDOWNColor - color of the "Down" price labels (clrYellow);
- SummColor - color of the profitability line (estimated) (clrWhite);
- TextColor - color of the text messages (clrAquamarine);
A line is shown from the rightmost current bar to the last signal. The equivalent of the points passed by the quote is indicated in figures, calculated according to the specified exchange rate, as well as duplicated in the text block.
The indicator features alerts, and it can also send similar messages to email.

商品标签