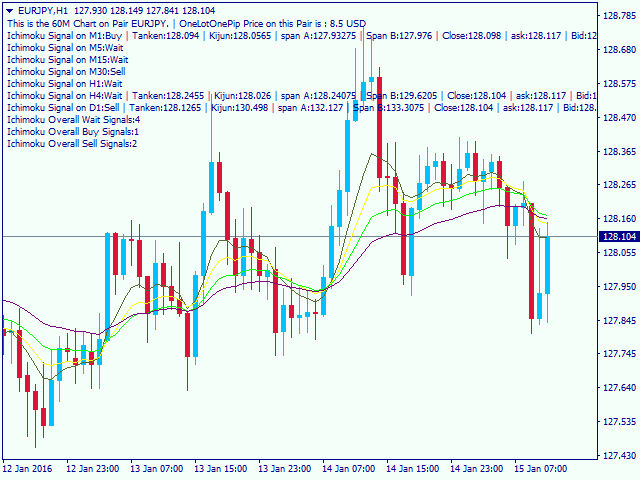
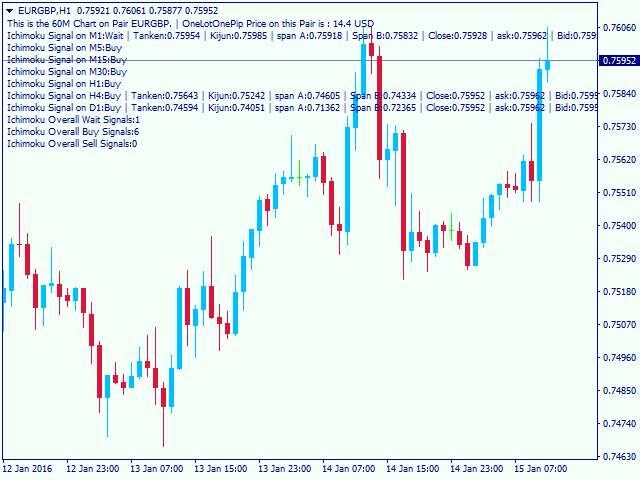
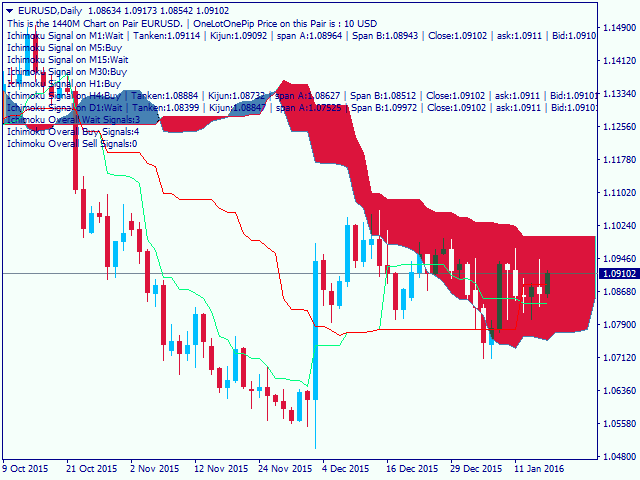
This is a multi-timeframe Ichimoku Kinko Hyo signal analyzer indicator. As you know, Ichimoku consists of 5 lines (Tenkan-sen, Kijun-sen, Chikou Span, Senkou Span A & B which create the Kumo Cloud).
Ichimoku is a simple indicator like Moving Average, but the method they use makes it a very good tool in detecting market conditions and trend with which you can open trades in the best location and stay in the trade till the most profitable price.
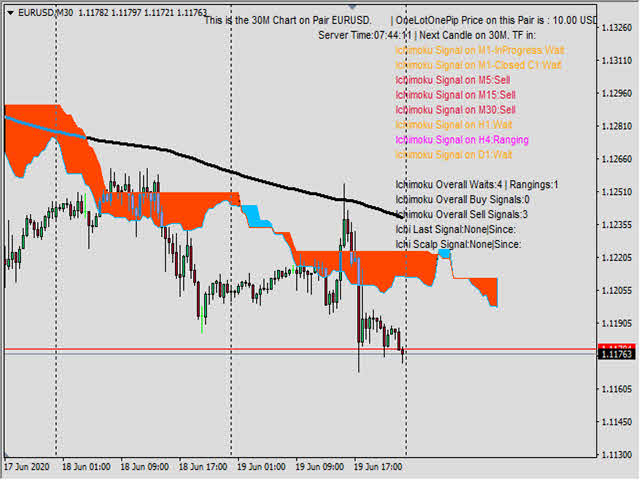
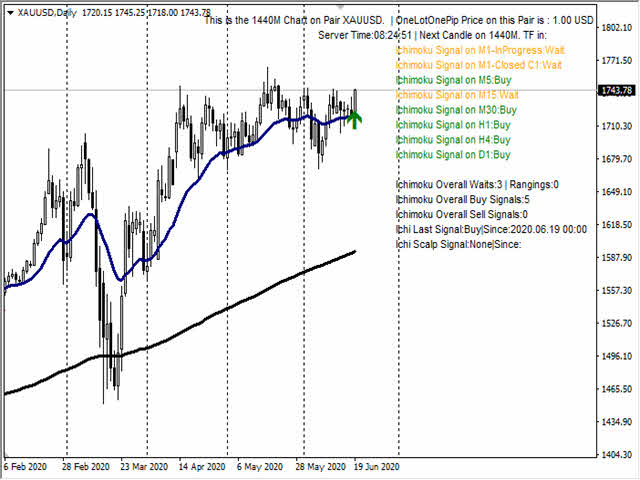
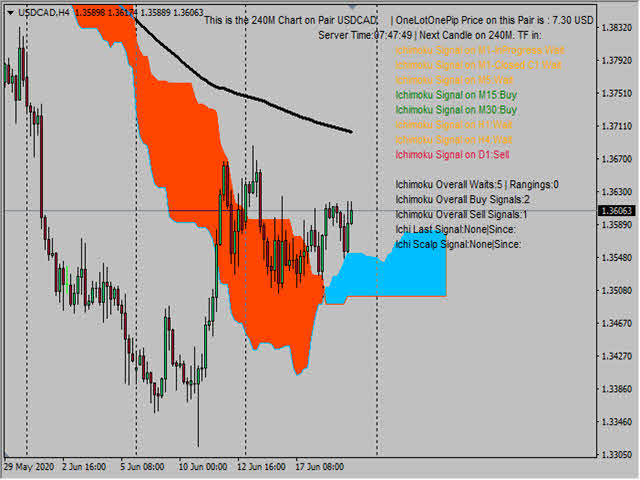
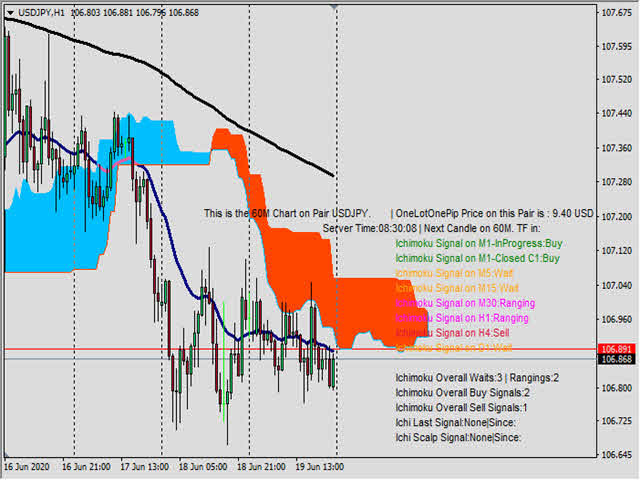
As this indicator has lots of lines and we should consider many factors when using it, I have written this indicator to analyze all those required conditions and give the signals for all timeframes at a glance.
Also there is a signal counter which shows and counts how many signals are generated in each condition (Buy, Sell or wait).
Indicator Settings:
- Tenkan-sen : default Ichimoku Tenkan-sen setting is 9.
- Kijun-sen : default Ichimoku Kijun-sen setting is 26.
- Senkou Span : default Ichimoku Senkou Span setting is 52.
- Higher Timeframe Candle number Selection : for the higher timeframes (H1, H4, D1) I have added a setting to select candle for analyzing. Default setting is 0 which is the last open (incomplete) candle, but you may prefer to analyze the last closed (complete) candle, so you can place 1 in this setting. In the lower timeframes (M1, M5, M15, M30) the analyzing is performed based on last closed candle (1).
How To Use This Indicator
The most useful method that I found in using this indicator is that you check the daily signal. In case daily signal was not "wait" and shows "Buy" or "Sell" then you check the other timeframes except for M1 (M5, M15, M30, H1, H4) when at least 2 of these 5 timeframes show the same signal as daily, then at the moment the M1 signal shows the same signal, enter a trade in that signal direction.
So with this method you can find the major trend of the market, check the rest of the timeframes compliance with major trend, then act at the best moment to scalp and get the intraday trades when the M1 is moving in the same direction and market is not in wait/recovery status.
I suggest that you do not trade when Daily or M1 are at "wait" status.
Always remember not to overtrade your accounts equity with trading with big lot sizes in which your account cannot tolerate the negative pullbacks.
Always remember to place Stop Loss in previous important support/resistance areas. Or better than that trade with loss recovery areas method in case a trade didn't go in your required direction.
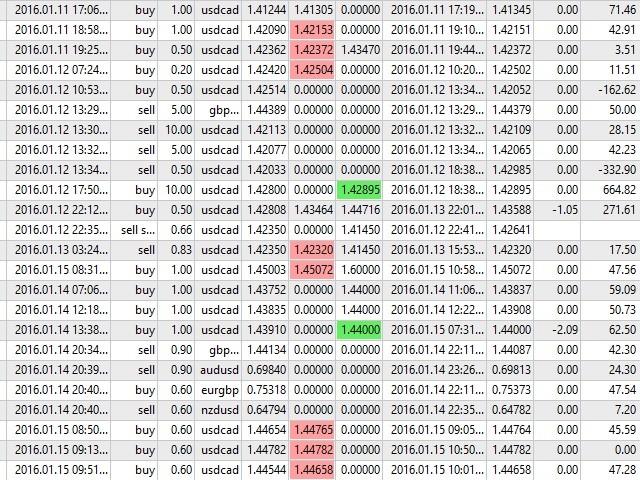
We have tested this method in the recent weeks and I have attached the manual trades that we had on a demo account to show you that this indicator is usable on every pair and every timeframe. As this was a demo account I traded with larger lot sizes, but on my real account I traded with more reasonable and smaller lot sizes and the result was quite good and I am going to write an expert with this indicator in near future.
Anyway, the trades picture is as a sample only and there is no guaranty that you get the same results if you don't take care on managing your trades or trade emotionally. Hope this indicator can be a handy tool on your charts next to your other tools.
If you have any other requirements or suggestions let me know to write the changes for you.


商品标签