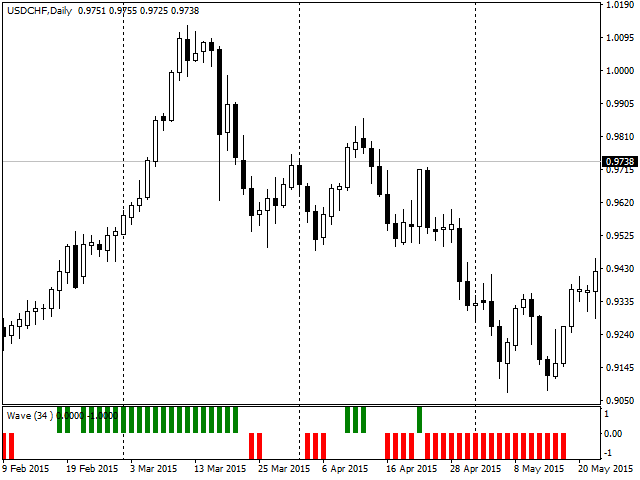
This is an implementation of the market cycle indicator described by Raghee Horner in the book "Forex Trading for Maximum Profit" .
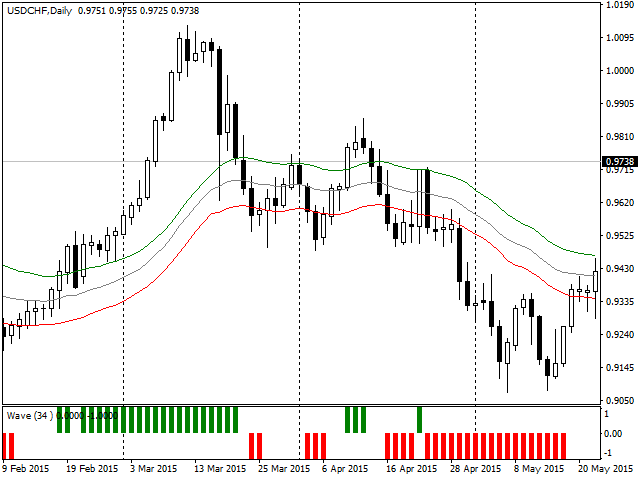
The current state of the market can be determined by analyzing the inclination angle of the exponential moving average (EMA) running on a period of 34 bars. If the EMA inclination is defined as the direction of the hour hand on the dial from 12 to 2 hours, then an uptrend is considered to be present; from 2 to 4 hours, the market consolidates; from 4 to 6 hours, a downtrend is considered to be present.
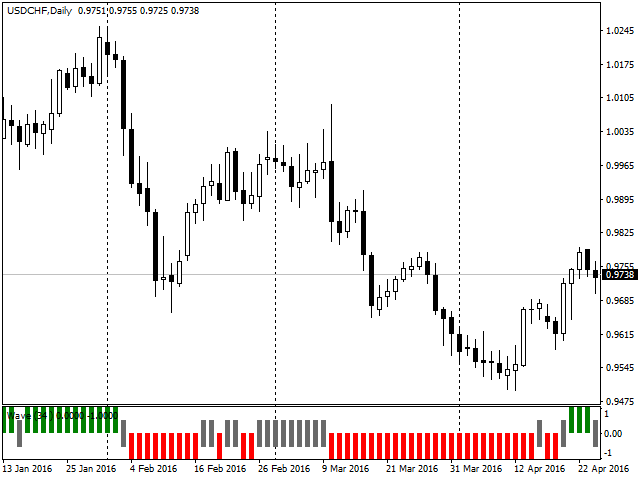
The indicator generates signals according to the following pattern:
- Green bars represent the presence of an uptrend, which appears when a bar closes above ЕМА 34 (High);
- Gray (or empty) bars represent the price consolidation, which appears when a bar closes within ЕМА 34 (High) and ЕМА 34 (Low);
- Red bars represent the presence of a downtrend, which appears when a bar closes above ЕМА 34 (Low).
Signals are confirmed when three candles of the same color appear.
Parameters
- EMA - period of the indicator's moving average
- Neutral signal - enable/disable the display of the neutral signal


商品标签