


Support/Resistance Percent Rank
SR Percent Rank helps to see how many times the current close price has been in the past price range. SR Percent makes a loop over x bars into the past and calculates the percentage of times the current closing price has been between the high and the low price in the x bars before that. So we can determine if the current price is moving at supports or resistance that was formed in the past.
I use the indicator when creating strategies with the StrategyQuant X program, where it is SR Percent Rank part of the program. Thanks to the machine learning algorithm in StrategyQuant X . I can test millions of strategies every day and filter them automatically thanks to sophisticated robustness tests.
The indicator has the following parameters:
Mode
- Mode 1 - calculates percentage occurrence of current close between high and low X bars back
- Mode 2 - calculates percentage occurrence of current close between high + Current ATR and low – Current ATR X bars back
Lenght
- This parameter sets the range of bars to search for the indicator of the number of occurrences of the current rate compared to the past rates. The higher the value, the stronger or more frequent support/resistance can be identified with it.
ATR Period
- ATR period that converges when using mode 2 in the ATR calculation in the formula: current close between high + Current ATR and low – Current ATR X bars back
Example:
We use the indicator with settings:
Mode = 1
Lenght = 120
ATR Period = 24
When we use Mode 1 we analyze:
I f the value of the indicator is above 50 we can say that the current value of the current close occurred between the past high - low more than 50% of the times.
If the value drops or falls steeply down to values close to zero we can say that a breakout is occurring and the current price has been moving between high - low values for the last 120 bars only minimally.
If the value of the indicator is rising we can say that the number of cases that have occurred at the current price is increasing and the price is getting close to support or resistance.
If we see very high values of the indicator , we can say that the price is definitely in or around the band of past supports and resistances and it is a good idea to adjust your entry or exit strategy in the context of the situation.
I developed this indicator to algorithmically identify situations where it makes sense to:
Place stop orders at breakouts at support or resistance
Limit orders to buy or sell at support or resistance.
When to be cautious when entering trades
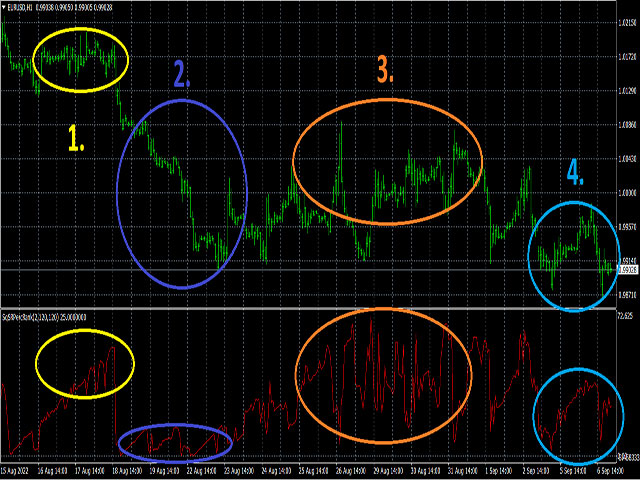
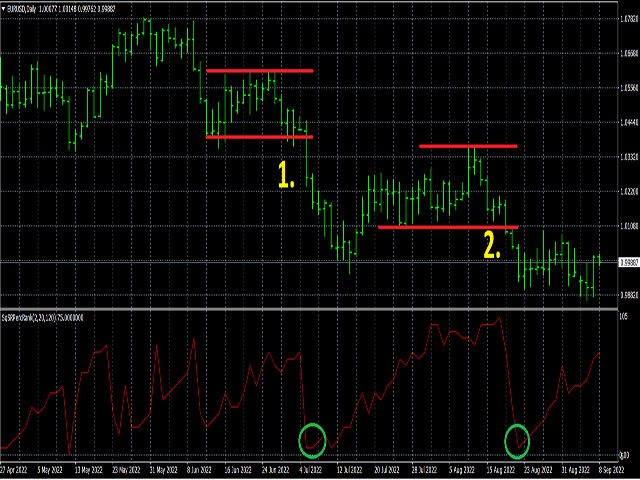
Chart Example
In situations where the market is in a support/resistance situation, we see that the indicator is rising and is at a high level
The market is in a trend phase the indicator is moving at a very low level
The market is oscillating in a support/ breakout zone, the indicator is oscillating at a high levels
There are false breakouts and breakouts in the indicator, at this point it is advisable to place order below or above support or resistance levels
商品标签


