This indicator is based on Market Profile methodology, which contains the Z-Zone , unlike the latter, allows visualization of multiple time frames on the same graph.
This methodology has proven to be very effective for:
- Reduce the number of windows required to analyze or track a financial asset.
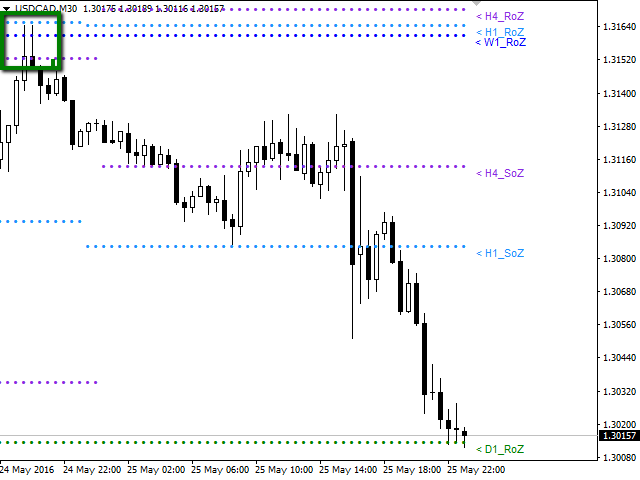
- Display important resistance areas (ROZ), support (SoZ) and average distribution (PoC) in different periods of time.
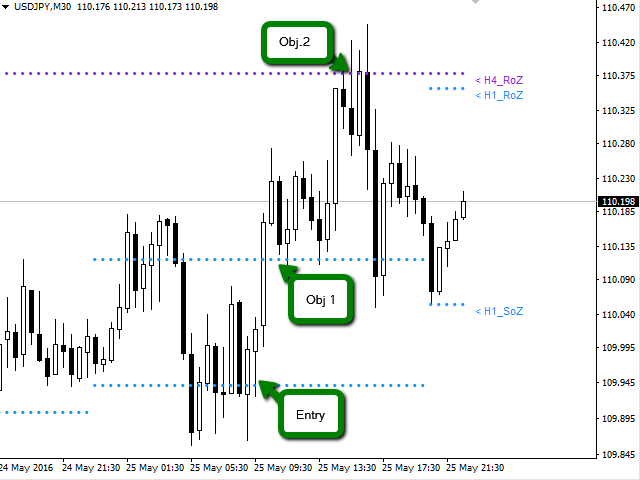
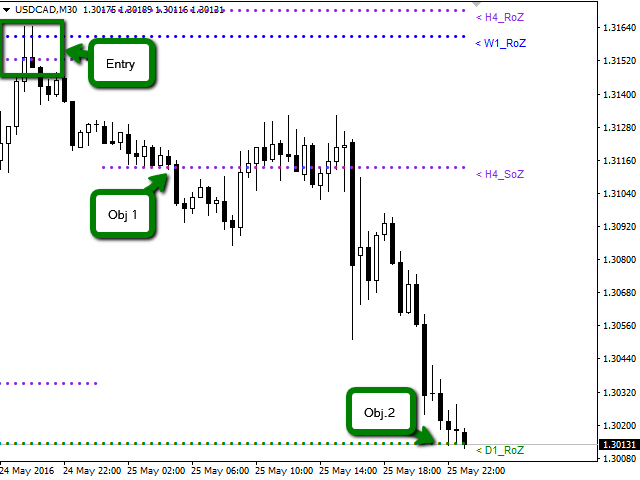
- Define areas to take profits as well locate technical stop loss.
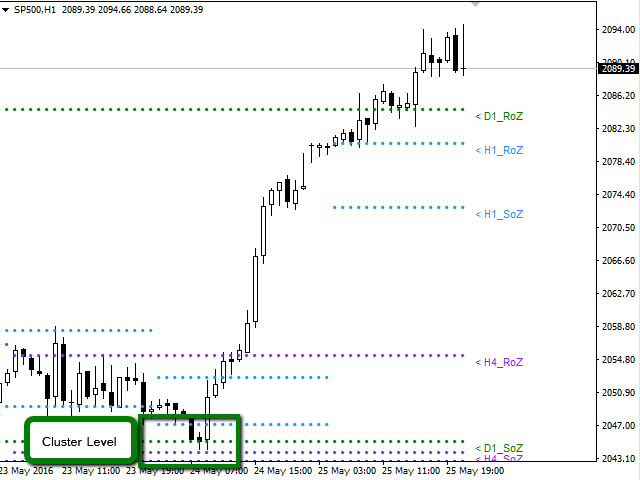
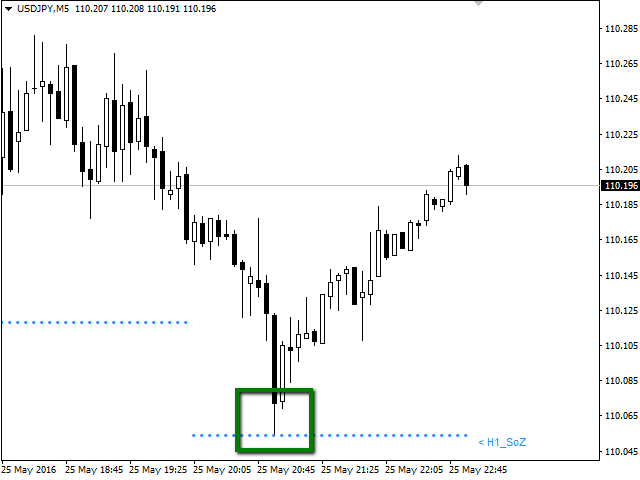
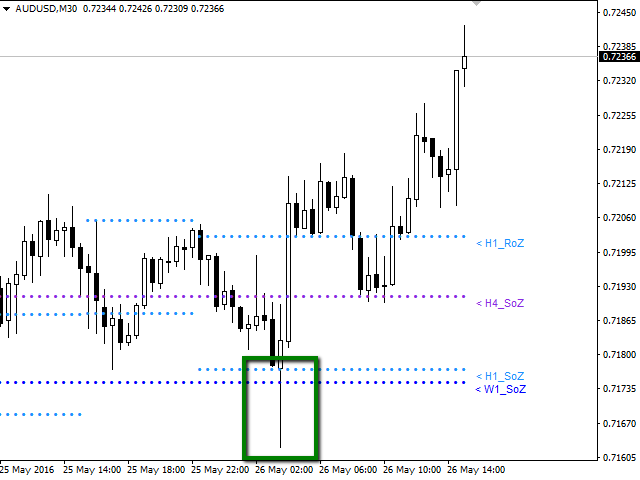
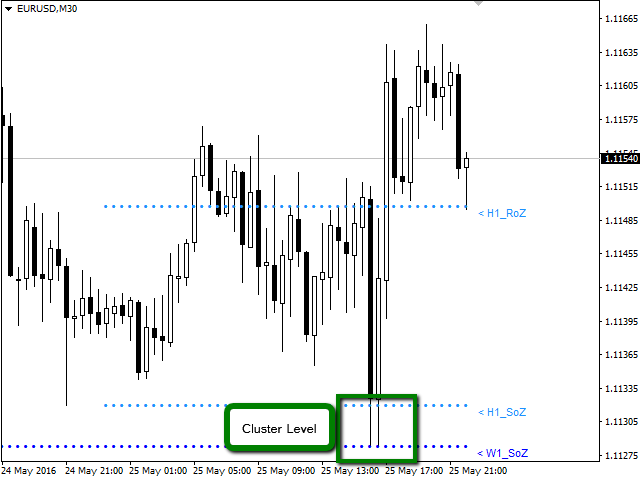
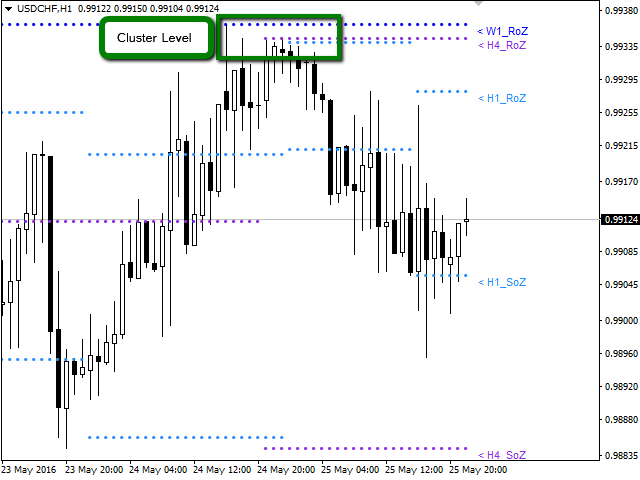
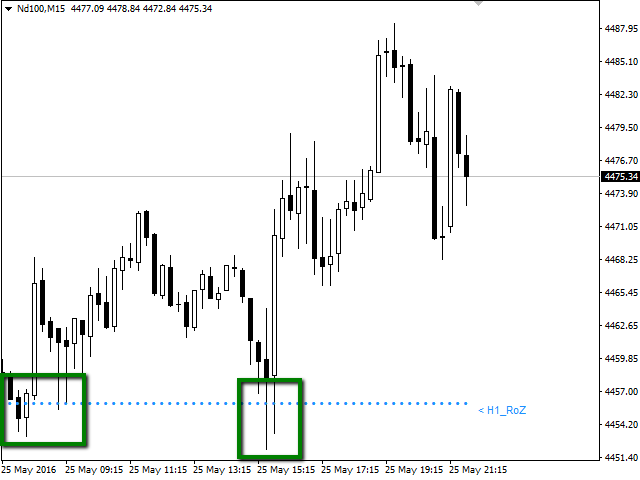
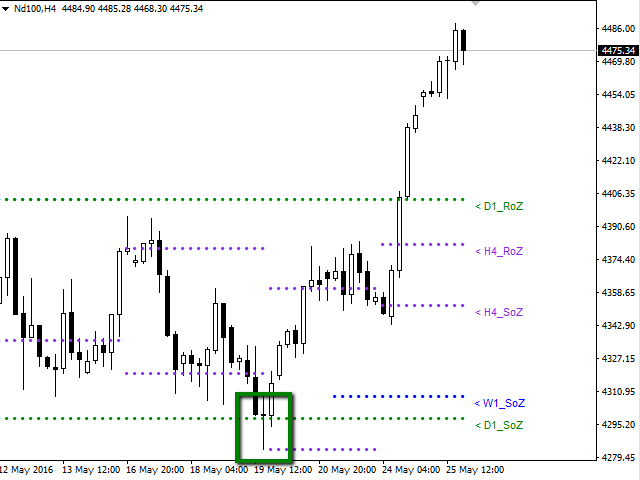
Analysis in the development of this indicator results shows that areas where different levels (H1, H4, D1, W1 and MN) converge are areas where the price reacts, creating opportunities for trend reversal, pivots or spikes (Vertical movements). Having learned this information, the trader has the advantage and can anticipate the opportunities and is ready to take action in the market at the right moment.
Available for: Forex, CFDs, Stocks, Futures and Commodities
Time Periods: M5, M15, M30, H1, H4, D1, W1, MN
Graphing in a same window the periods: H1, H4, D1, W1, MN.
The indicator is optimized, designed to help the trader. For this reason, only it will graph periods equal to or greater than the active window. This mean, if you are in a D1 period you will see in the window only W1 and MN1 periods chart, omitting H1 and H4 periods.
Indicator Parameters
- Sector_A: Select Objects to Chart
- H1_RoZ: Graphs resistance zone (ROZ) for the frame H1. By default is true.
- H1_RoZ: graphs average distribution area (PoC) for the frame H1. By default is false.
- H1_RoZ: graphs support area (SoZ) for the frame H1. By default is true.
- H4_RoZ: Graphs resistance zone (ROZ) for the frame H4. By default is true.
- H4_RoZ: Graphs average distribution area (PoC) for the frame H4. By default is false.
- H4_RoZ: Graphs support area (SoZ) for the frame H4. By default is true.
- D1_RoZ: Graphs resistance zone (ROZ) for the frame D1. By default is true.
- D1_RoZ: graphs average distribution area (PoC) for the frame D1. By default is false.
- D1_RoZ: graphs support area (SoZ) for the frame D1. By default is true.
- W1_RoZ: Graphs resistance zone (ROZ) for the frame W1. By default is true.
- W1_RoZ: graphs average distribution area (PoC) for the frame W1. By default is false.
- W1_RoZ: graphs support area (SoZ) for the frame W1. By default is true.
- MN_RoZ: Graphs resistance zone (ROZ) for the frame MN. By default is true.
- MN_RoZ: graphs average distribution area (PoC) for the frame MN. By default is false.
- MN_RoZ: graphs support area (SoZ) for the frame MN. By default is true.
- Sector_B: Select Inputs Parameters
- Map: This parameter is used to calculate support and resistance zones. By default is 7.
- Length: This parameter is used to calculate the volume price zones. By default is 5.
- Signal: This parameter defines the frequency to create a new zone. By default is 18.
- Sector_C: Select Label to Chart
- H1_Label: You can disable the display on the chart labels for each period. By default is true.
- H4_Label: You can disable the display on the chart labels for each period. By default is true.
- D1_Label: You can disable the display on the chart labels for each period. By default is true.
- W1_Label: You can disable the display on the chart labels for each period. By default is true.
- MN_Label: You can disable the display on the chart labels for each period. By default is true.
- Sector_D: Select Parameters the Color and Width to Chart
- Color_H1: Change the color of the points are plotted on the graph. By default is Aqua
- Color_H4: Change the color of the points are plotted on the graph. By default is BlueViolet.
- Color_D1: Change the color of the points are plotted on the graph. By default is Green.
- Color_W1: Change the color of the points are plotted on the graph. By default is DodgerBlue.
- Color_MN: Change the color of the points are plotted on the graph. By default is LightGoldenrod
- Width_H1: You can change the thickness of the points are plotted on the graph. By default is 0.
- Width_H4: You can change the thickness of the points are plotted on the graph. By default is 0.
- Width_D1: You can change the thickness of the points are plotted on the graph. By default is 0.
- Width_W1: You can change the thickness of the points are plotted on the graph. By default is 0.
- Width_MN: You can change the thickness of the points are plotted on the graph. By default is 0.


商品标签